The case of American Exceptionalism- Part 6
- Soham Mukherjee
- Sep 29, 2018
- 6 min read

We will continue our look into the reasons underlying the surge in inequality over the past several decades and how it has contributed to a decline in American growth. Last time we investigated inequality in wages and concluded that a few special circumstances allowed executives to see skyrocketing pay while everyone else suffered through stagnant wage growth. Now we will look at income from capital and get a greater for appreciation for the structure of capitalism while drawing some intriguing conclusions.
Once again we will consider ideas advanced in Thomas Piketty's book, Capital in the 21st Century. All figures are sourced to the author of the book.
So who owns the capital in any given society? It turns out that, unsurprisingly, the very wealthy own a majority of the capital, but some may find the actual figures quite shocking.
The table below shows different percentages of total capital held by the respective social classes.
For example the table is read as “In 2010 the top 10% owned 70% of total capital”. It is evident that the United States is currently in a state of great inequality, but it is important to realize that inequality is a “natural” phenomena.
On the left, the table shows what levels of inequality have never been observed, and we can see that some of the lowest levels ever observed still gave the top 10% half of the total capital.

The bottom half of society barely own any capital, a rather worrying result. The pre-World War I European atmosphere suffered from extreme inequality but gradually fell in the ensuing decades.
In the next graph we look at how wealth of the top classes has changed over time. We see a drop in the richest class’ share of capital, described as wealth in the graph, during the period we have associated to be of greatest growth (1920-1970) and a steady increase in the share in the past several decades, which has notoriously exhibited weaker growth.
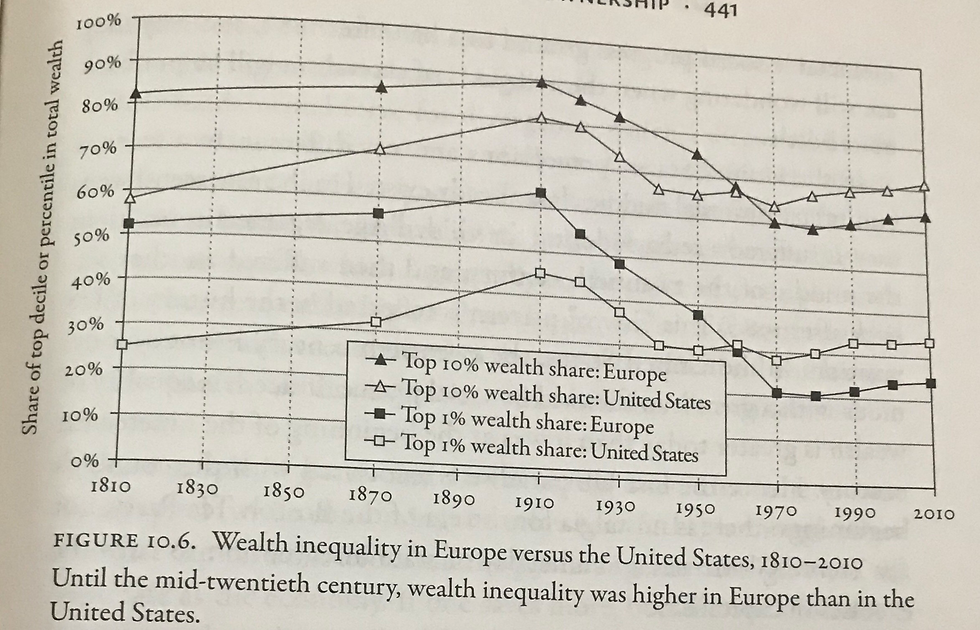
We note that both the decrease in inequality in the middle of the 20th century and the climb that followed was not restricted to the United States but was rather a global phenomena. We can safely assume that the catastrophes of World War I, Great Depression, and Second World War had a detrimental impact on the share of wealth owned by the richest classes.
To get an idea on how much of total wealth in the world comes from capital as opposed to labor, we can look at the capital to income ratio, which shows the ratio between income from capital and total national income. A higher ratio means more income comes from capital; a lower figure means labor income is more prominent.
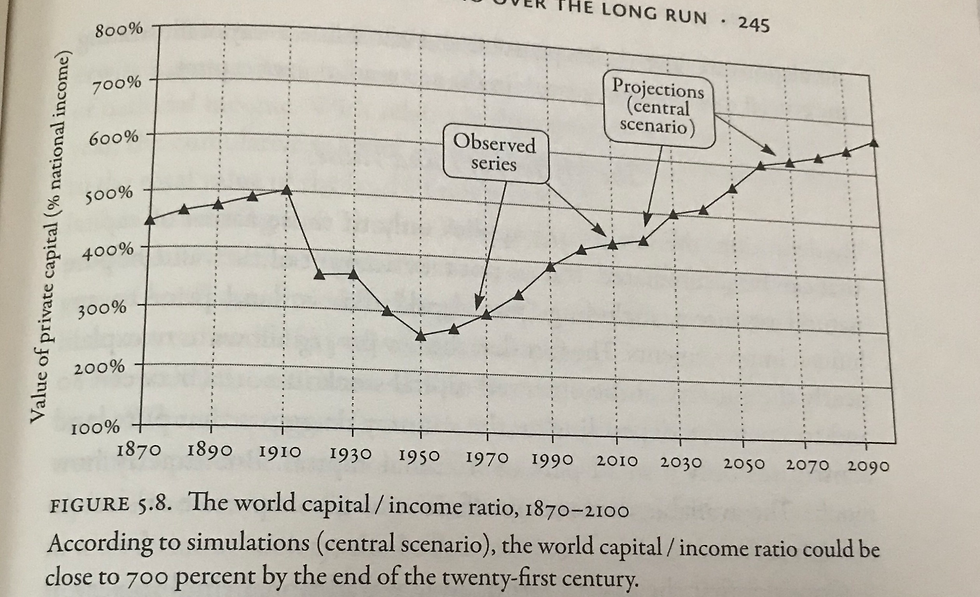
The graph serves as another piece of evidence that the catastrophes of the first half of the 20th century harmed capital, and the nadir corresponds to where the period of tremendous growth was in its latest stages (1950/1960). The return of the capital/income ratio to previous highs corresponds to the weakened growth we have discussed.
So why has the wealthiest group’s share of capital ownership accelerated in some periods and fallen in others? Well let’s assume that capital earns a rate or return denoted r. We will keep things very broad in terms of what constitutes capital, but our previous definition of any non-human asset that can be readily traded can be used to illustrate the following points.
Similarly we will define the growth of the national income, think total earnings of a country, by a rate g.
So now we have two rates of return: g and r. It is helpful to think of g as determining how wages grow and r as how capital gains rise. For any individual in a society we can imagine his income depending on how much capital he owns, whose return generated depends on r, and his labor income, whose growth depends on g.
But we saw earlier that the wealthiest own almost all of the capital! So most citizens will depend on labor income, and hence g, for most of their wealth to grow, while a select few will be able to reap capital gains more than income from their labor.
But when does this crossover occur, when individuals have more capital income than labor income? The answer may surprise you. The two graph below shows at what percentile of total wealth individuals start to gain more from capital than labor. The first one shows the data in 1929, and the second graph shows the data in 2007.

So we see that only the super wealthy (Top .5%) will gain most of their income from capital, while the rest are dependent almost entirely on their labor income. There has been a shift over the last century where instead of the top 1% being the threshold (See the first graph) it is now only the top .5%. So capital has further fallen into the hands of the super-super wealthy over the last 80 years, creating greater inequality.
Now that we have established that the super wealthy hold a disproportionate amount of capital and that the rest depend on labor income, we can go forward with the concept that the super wealthy will depend more on r, the rate of return on capital, while everyone else will depend on g, the growth rate of national income.
So how does the rate of return of capital compare to the rate of economic growth?

This graph is key to the development of any market economy, for the relationship between r and g represents the fundamental divergence to inequality. For most of human history, the rate of return on capital has been much higher than the economy’s growth rate, but a flurry of events we have extensively discussed managed to push r to its lowest levels ever. Couple that fall in r with unprecedented growth in g and we see that there was a brief period in world history when the growth rate of the economy exceeded the return on capital.
All that was required for g to exceed r were two cataclysmic world wars, the largest economic disaster in world history, revolutionary technological innovations that can only happen once, and tremendous demographic growth. In a nutshell, it is the natural state of the world for r to be greater than g, and the stars had to align for the reverse to occur for a short period of time.
The main conclusion is that the structure of any economy allowed for very high levels of inequality, and it is not reasonable to expect the world to replicate the brief surge seen in the middle of the 20th century.
To get an idea of how the return of capital suffered for several decades, look at the graph below of the Dow Jones Industrial Average over the last 100 years. Stocks obviously are only one form of capital but it is evident that after the crash in 1929 it took a long time before equities regained their post-Depression highs.

So is all hope lost if r is (almost) always going to be greater than g?
Well there can be some policy actions to try and reduce r, but as we have investigated, increasing g (think increasing productivity) is going to be very difficult in the absence of technological shocks or strong demographic growth. To reduce r the government could implement higher taxes on capital, but that may run into a few obstacles. If nations compete to attract capital into their country for investment, it makes sense for them to lower taxes on capital to appear more competitive; the result is “race to the bottom” for a tax on capital. Given the policymakers in many countries are among the wealthiest (and thus have a lot of stake in capital), they may be less eager to make decisions that could hurt their stock of wealth.
So we covered a lot of material in this installment, and it not only pertains to the rise and fall of American growth but is a key aspect of the global economy any student of business should understand. In the next piece we will address a buffet of assorted smaller issues that many often associate with present day problems. If anyone has any specific issues they would like me to address, feel free to comment or notify me as I would be more than happy to integrate questions in future articles.


Comments